
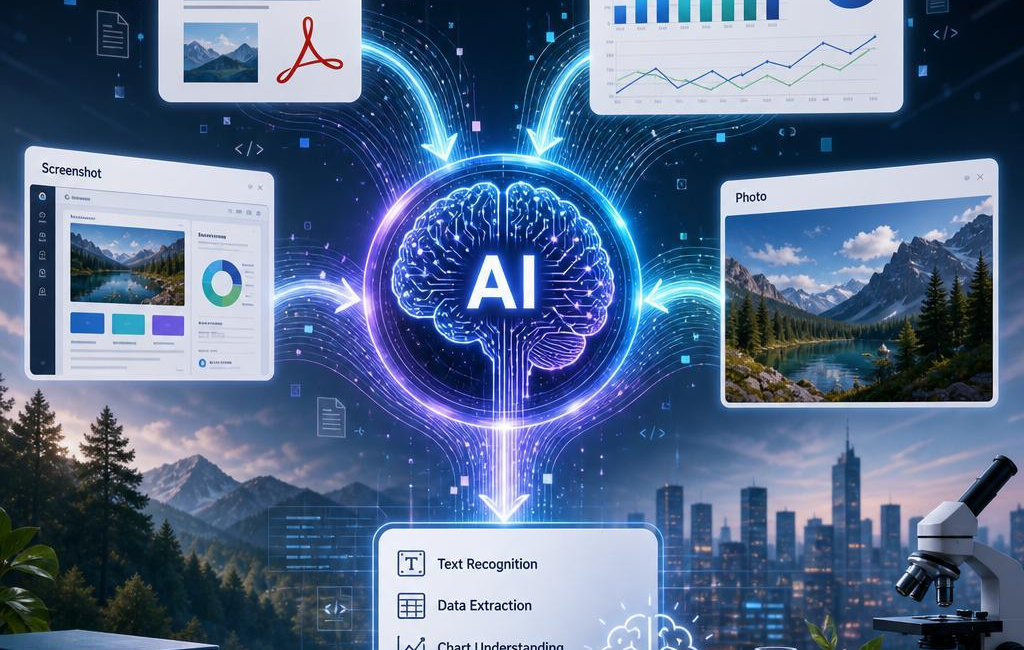
Can AI Read PDFs and Images?
Yes-many multimodal systems can analyze PDFs,charts,screenshots,and photos. but “read” means more than pulling words from a page. A useful system has to connect text with layout, labels with visualsand footnotes with the claims they qualify.
Think about a financial report. The written summary may describe quarterly performance, a chart may show the trendand a note at the bottom of the page may explain an exception or change in methodology. Reading only one of those pieces can lead to the wrong conclusion. The value comes from considering them together.
having mentioned that, AI interpretation is not magic. A blurry screenshot can conceal a decimal point. A scanned PDF can produce garbled text. A chart without a visible scale may show a general direction without proving the size of a change. The best results come from treating the file as evidence, being clear about what is visibleand flagging anything that is uncertain.
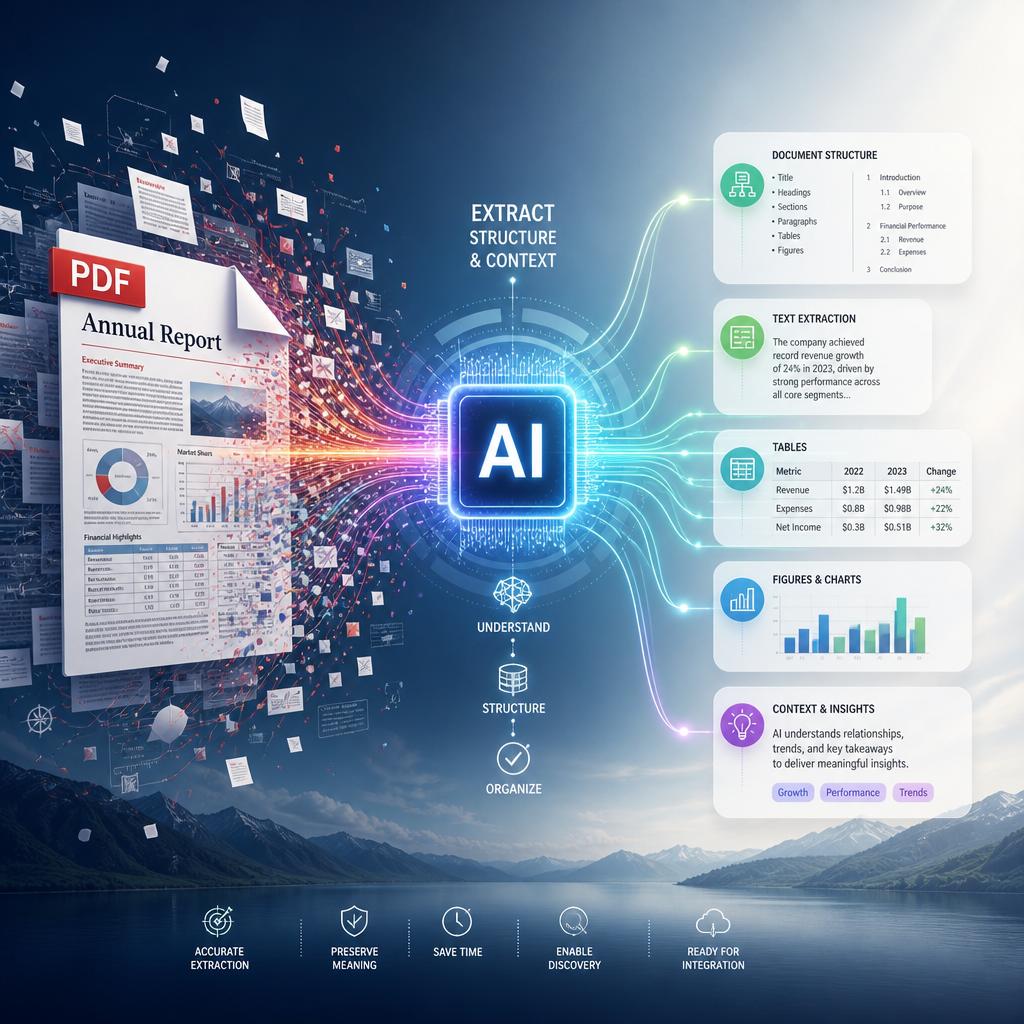
How AI Makes Sense of a PDF
A PDF is often more complex than it looks. One document might include selectable text, scanned pages, columns, tables, charts, forms, notesand images with text inside them. Rather than treating the page as one block, AI can identify the different parts and work out how they fit together.
For scanned pages, text recognition might potentially be needed before the content can be searched or summarized. Layout also matters.A heading shoudl stay connected to the paragraphs below it, a caption should be associated with the right imageand a sidebar should not be mistaken for the main body of the document.The same number can mean very different things depending on weather it appears in a table cell, a chart legendor a footnote.
This is especially useful in reports,research papers,invoices,and presentation-style PDFs. When the structure is clear, AI is more likely to read a table as a set of rows and columns instead of a loose collection of figures. It can also use nearby text to make sense of abbreviations, referencesand chart labels. Still, dense pages and poor scans deserve a second look-particularly when the answer depends on a small number, a qualifieror a note in fine print.
Reading Charts, Screenshotsand Photos Carefully
Charts and screenshots need a little more care as their meaning is spread across position, color, labelsand scale. Before drawing a conclusion from a chart, it helps to identify the title, time period, units, axes, legendand source note. A line moving upward may look persuasive at first glance, but it does not necessarily show a large or meaningful increase. The vertical scale might potentially be truncated,the date range may be selective,or the chart may compare measures that are not directly comparable.
AI can often identify bars, lines, points, labelsand table cells in an image. It may also extract text from a screenshot and relate it to what appears on screen. Small details remain a common source of error, tho: tiny numerals, overlapping labels, faint lines, cropped legendsand color keys that are hard to distinguish. If an exact figure matters, compare the extracted result with the original image rather than assuming every value was read perfectly.
Photos bring a different kind of uncertainty. AI may be able to describe visible objects, settingsand actions, but a photograph does not always explain the full situation. Viewpoint can distort scale, shadows can change apparent colorand an image may leave out the context needed to identify an event or object with confidence. Good analysis separates what can plainly be seen from what is only a reasonable guess.
How to Get better Results
Clear source material makes a real difference. When possible, export PDFs with selectable text, keep pages in the correct orderand make sure they are rotated properly. For charts, include a readable title, labels, units, datesand a legend. Avoid putting significant text over busy backgrounds or relying on color alone to communicate meaning.
With screenshots, include enough of the surrounding interface to explain what the reader is looking at. A cropped number might potentially be useless without the column header, filter setting, date rangeor request context beside it. For photos, use a sharp, well-lit image and include another angle when a detail is obscured by glare, distanceor shadow.
- Use high-resolution files when small text or detailed tables matter.
- Keep titles, dates, unitsand labels visible in charts and screenshots.
- Add a short instruction when you need the AI to inspect a specific detail or answer a particular question.
File organization helps, too. Use descriptive names, keep related pages togetherand avoid combining unrelated documents into one large upload. If a page contains handwriting, a complicated tableor fine print, say so. A little context can prevent the system from overlooking the one detail you actually need.
The Bottom Line
AI can be very useful for reading documents and images, especially when information is spread across text, tables, chartsand visuals. Its strongest work comes from connecting those elements rather of treating them as separate pieces.
But the original file still matters. Clear formatting, readable labels, complete screenshotsand sensible context give AI a better chance of producing an accurate answer. When the source is unclear-or when the conclusion depends on a tiny number or a subtle note-the safest approach is to verify the result against the original.
AI tools built by Emerald Force
Built and supported by Emerald Force.

You might also like
AI Worker Monitoring: Legal Limits Employers Face
- How AI Reads PDFs, Charts, Screenshots, and Photos
- Access Control in AI: Rules for Use and Access
- AI Rationales Aren’t Always Faithful Explanations
- AI for Homework: Tutoring Allowed, Final Answers Limited
- AI in Healthcare: The Risks of Overtrust
- Large Language Models: How They Learn Language
- The New Jobs AI Is Creating Across the Economy
- AI Can Support Peer Review, Not Replace Reviewers
- Can AI Create Logos? Speed, Originality, and Legal Risk