

Understanding the Core Components of Observability in AI Systems
In the realm of AI systems, achieving full observability extends far beyond simple performance metrics. It involves a complex interplay of key components that enable teams to track, diagnoseand improve AI models in production. At the heart of this process lies the continuous monitoring of model behavior, data driftand system health. These components are critical for ensuring that AI outputs remain reliable and aligned with expected outcomes despite changes in input data or environmental conditions. By implementing granular logging and real-time telemetryorganizations can detect anomalies that may indicate model degradation or unexpected biases, allowing for proactive interventions before these issues impact end users.
To visualize how observability elements interact, consider the following table outlining core observability components alongside their primary functions and benefits:
| Component | Function | Benefit |
|---|---|---|
| Model Monitoring | tracks AI predictions and confidence levels | Identifies drift and performance degradation |
| Data Pipeline Observability | Ensures input data consistency and quality | Prevents contamination and errors |
| Infrastructure Metrics | Monitors resource utilization and latency | Maintains system stability and responsiveness |
| Alerting and Logging | Captures anomalies and operational events | Enables rapid root cause analysis |
Integrating these components allows AI practitioners to build a holistic observability framework, making transparent what was once a black box.This transparency is essential not only for maintaining technical robustness but also for fostering stakeholder trust in AI-driven decisions.
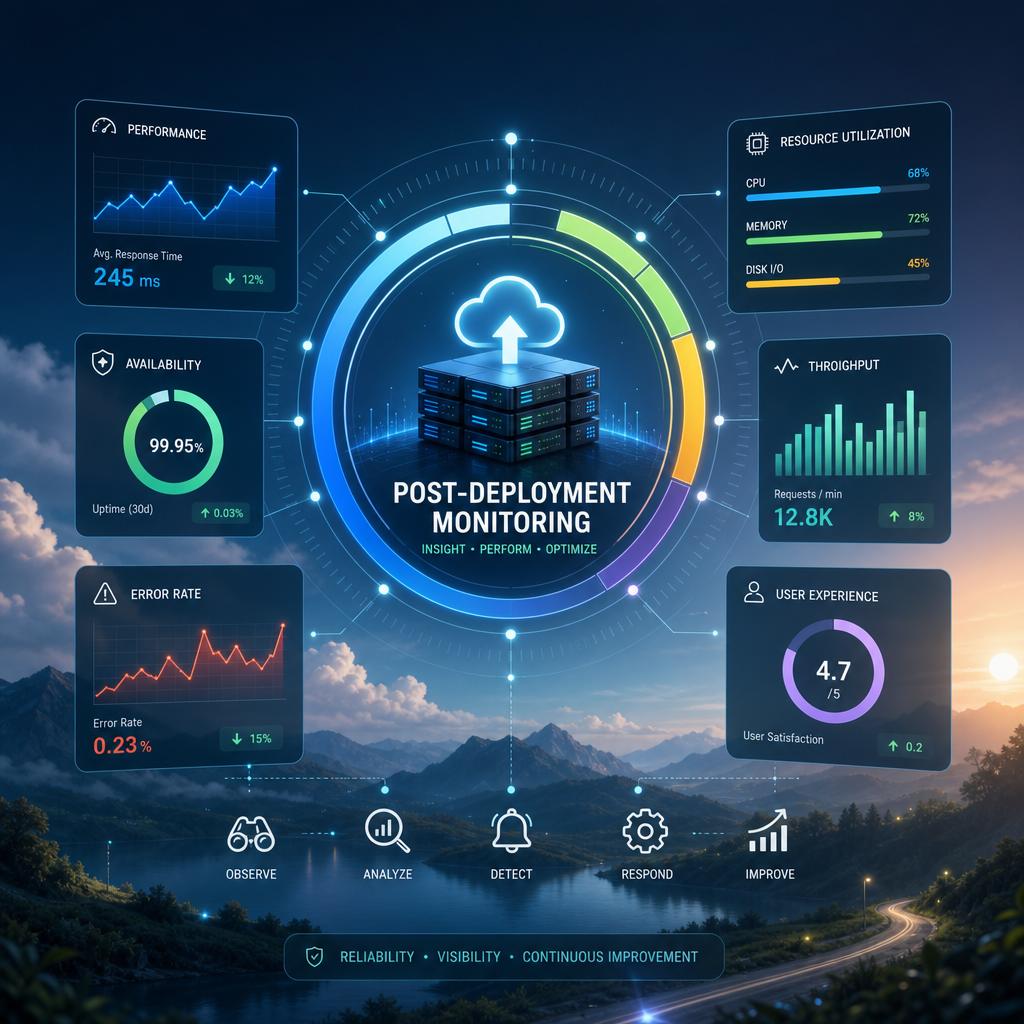
Key Metrics and Indicators for Effective Post-Deployment Monitoring
Successful post-deployment monitoring hinges on identifying and tracking key performance metrics that truly reflect the health and effectiveness of AI systems. These metrics go beyond basic uptime or latency, focusing rather on indicators such as model accuracy drift, data distribution changesand prediction confidence levels. For example, consistent degradation in model accuracy or an unexpected shift in input data patterns can signal the need for retraining or intervention before user experience is impacted. Additionally, monitoring system resource utilization provides insights into the scalability and reliability aspects that are crucial for real-world applications.
Understanding these dimensions requires a comprehensive approach incorporating both quantitative and qualitative data points. Critical indicators often include:
- Prediction Latency: Average response time of the AI model under various load conditions.
- Model Confidence Scores: Distribution and variation in confidence levels over time.
- Error Rates: Frequency and types of incorrect predictions or anomalies detected.
- Data Drift Metrics: Measures of how input feature distributions differ from the training dataset.
| Metric | Purpose | Ideal Threshold |
|---|---|---|
| Accuracy Drift | Track changes in prediction correctness | < 2% decline per month |
| Latency (ms) | Ensure timely responses | < 100 ms |
| Confidence Variation | Detect unreliable predictions | Minimal variance |
By carefully selecting and continuously analyzing these metrics, organizations can ensure their AI systems remain robust, trustworthyand aligned with their intended business objectives over time.
Strategies for Real-Time Anomaly Detection and Root Cause Analysis
Implementing effective real-time anomaly detection requires a combination of robust data collection and intelligent analysis algorithms that can adapt quickly to evolving AI model behaviors. By continuously monitoring key performance indicators and system metricsorganizations can detect irregularities such as unexpected latency spikes, sudden accuracy dropsor unusual resource consumption. To enhance precision, it is indeed essential to employ machine learning techniques such as unsupervised learning or statistical process control that distinguish between normal fluctuations and genuine anomalies. Additionally, integrating automated alerts with visualization dashboards empowers teams to respond immediately, reducing downtime and potential negative impacts.
Root cause analysis becomes highly effective when supported by a structured approach that combines correlation analysis, dependency mappingand historical data comparison. Teams should leverage log aggregation and traceability tools to dive deep into the event pipeline, identifying the initial trigger among multiple cascading issues. Below is a simplified overview of key components and methods often used in this process:
| Component | Method | Purpose |
|---|---|---|
| Data Ingestion | Anomaly Scoring | Quantify deviation from the norm |
| Event Correlation | dependency mapping | Identify causal relationships |
| System Logs | Log Pattern Mining | Detect root error signatures |
| Historical Metrics | Trend Comparison | Spot recurring issues |
Combining these techniques with AI-powered observability tools creates a resilient environment where issues can be pinpointed and resolved swiftly, ensuring sustained reliability after deployment.
Best practices for Maintaining AI Model Performance and Reliability Over time
Maintaining the consistent performance and reliability of AI models in production demands proactive strategies that address not only the initial deployment but also the long-term operational lifecycle. A cornerstone of effective maintenance is establishing a robust monitoring framework that continuously tracks model outputs, input data qualityand system health metrics. This ongoing vigilance helps identify subtle shifts or anomalies-such as data drift, concept driftor infrastructure issues-that could degrade performance. Key practices include implementing real-time alerting for performance deviations and integrating feedback loops with domain experts to validate model behavior and recalibrate models as necessary.
Best practices for preserving AI model efficacy extend beyond technical monitoring to include:
- Periodic retraining on fresh, representative datasets to adapt to evolving environments.
- Comprehensive logging of predictions and input features to enable retrospective analysis and troubleshooting.
- Version control for both data and model artifacts to ensure reproducibility and facilitate rollback if issues arise.
- documentation and governance to maintain clarity around model assumptions, limitationsand compliance requirements.
| Practice | Purpose | Outcome |
|---|---|---|
| Real-time alerting | Detect performance degradation | quick issue identification |
| Periodic retraining | Adapt to new data patterns | Model accuracy retention |
| Comprehensive logging | Trace errors and biases | Improved troubleshooting |